Using FT-IR to measure the chemical composition of PM2.5
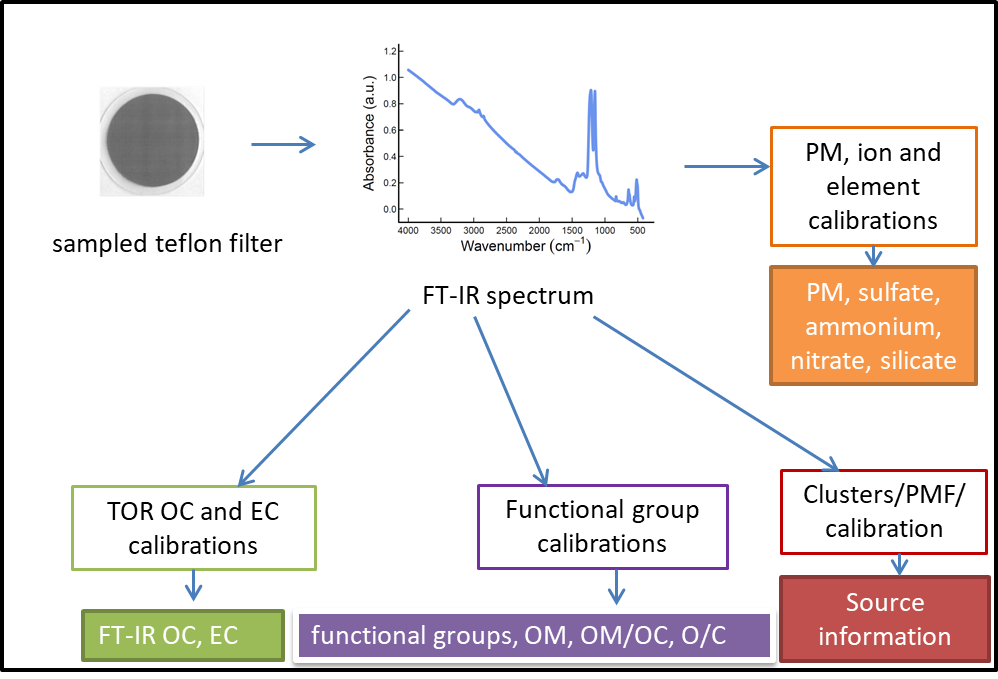
A teflon aerosol sample is non-destructively analyzed by FT-IR to produce an FT-IR spectrum. Calibrations (non-colored boxes) are applied to the spectrum to obtain aerosol composition and sources (colored boxes).
- FT-IR analysis and multivariate calibrations measure
- TOR-equivalent OC and EC,
- Functional groups such as aliphatic CH, carboxylic acids, carboxylates, non-acid carbonyl and alcohol OH (carbohydrates)
- Inorganic ions including sulfate, nitrate and ammonium
- Soil elements
- PM mass
- FT-IR spectra and cluster analysis identify sources of PM
- Partial least squares regression, ridge regression and principal component analysis are used for evaluation and quantification
- FT-IR is a non-destructive which allows the filter samples to be analyzed by other non-destructive methods such as gravimetric for mass, XRF for elements, HIPS for light absorption, or destructive methods such as ion chromatography for ions or GC/MS for organic compounds after FT-IR analysis
- FT-IR is fast and typically less expensive than other methods
FT-IR analysis procedures
Teflon filter samples (25 mm, 37mm, or 47mm) are loaded into a filter holder (Figure 1), placed into the sample holder (Figure 2) and the lid of the sample chamber is closed. The sample chamber is purged with CO2 and water vapor free air and an FT-IR spectrum is collected (Figure 3). Three FT-IR instruments in the laboratory (Figure 4) are used to routinely analyze all PM2.5 teflon filters in the IMPROVE, CSN and SPARTAN networks. MAIA samples will be analyzed for the duration of the mission. Figure 5 shows three spectra of IMPROVE samples collected in Fresno, CA. Regions of the spectra are identified by organic functional group, inorganic ion and scattering and absorption by the teflon filter.
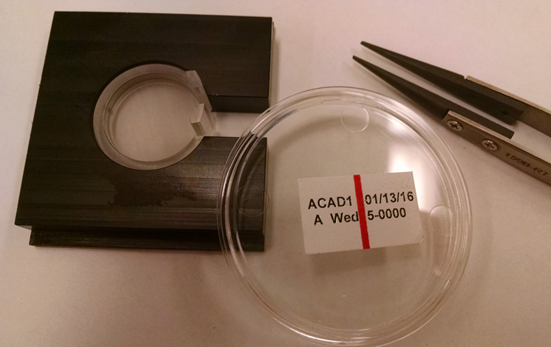
Figure 1. 25 mm teflon filter from IMPROVE network in the FT-IR sample holder
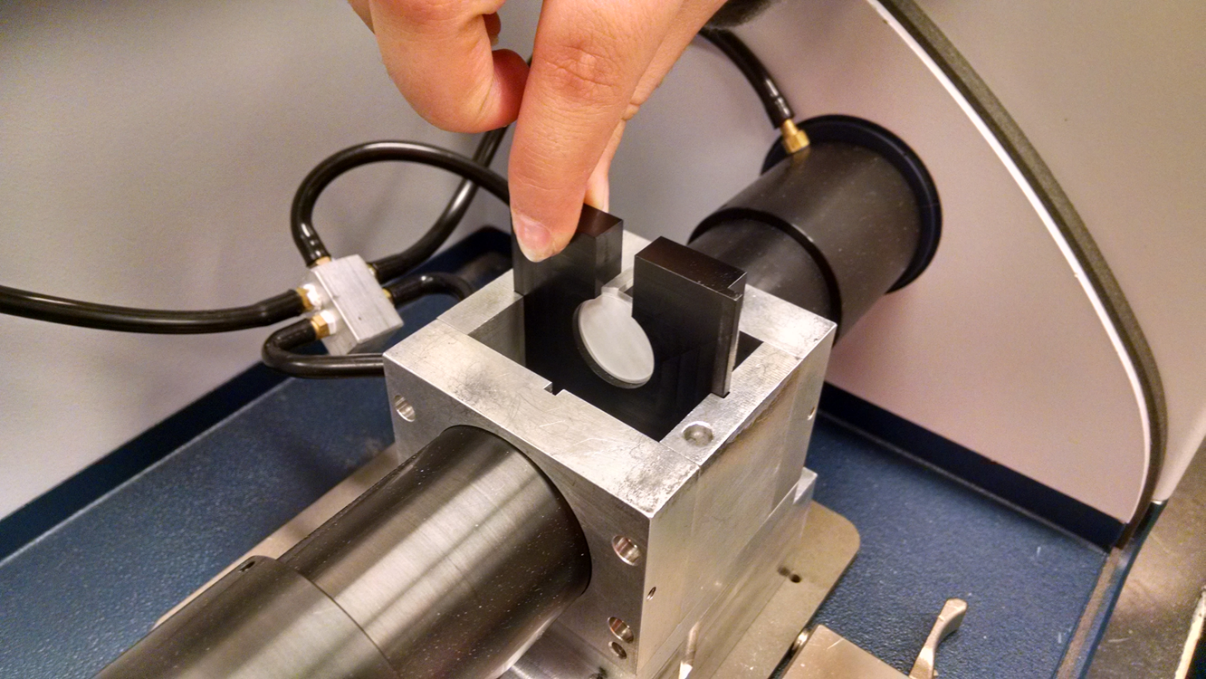
Figure 2. Sample holder and filter installed into FT-IR sample chamber
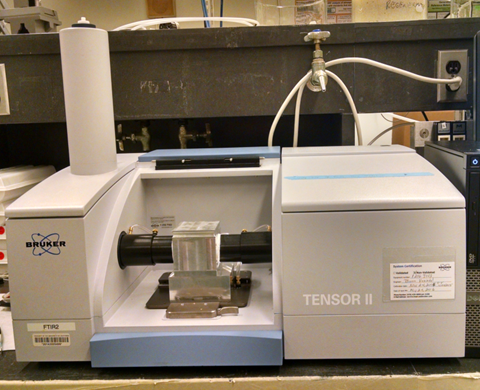
Figure 3. One of three FT-IR instruments in Dr. Dillner’s laboratory
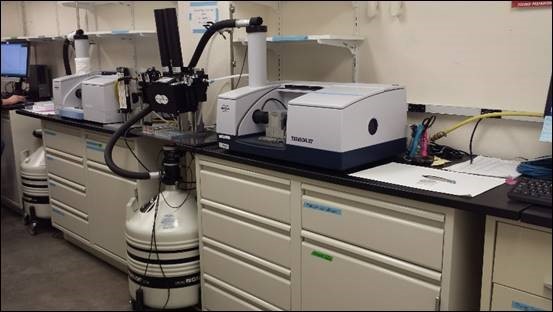
Figure 4. FT-IR Lab