EOS: Advances in Satellite Data for Wildfire Smoke Forecasting
By Susan O’Neill and Sean Raffuse
Originally posted in EOS on 26 February 2021: https://eos.org/science-updates/advances-in-satellite-data-for-wildfire-smoke-forecasting
Observations from the newest geostationary Earth-observing satellites are offering valuable views of fire progression and smoke plume development and helping simulate impacts from large wildfires.
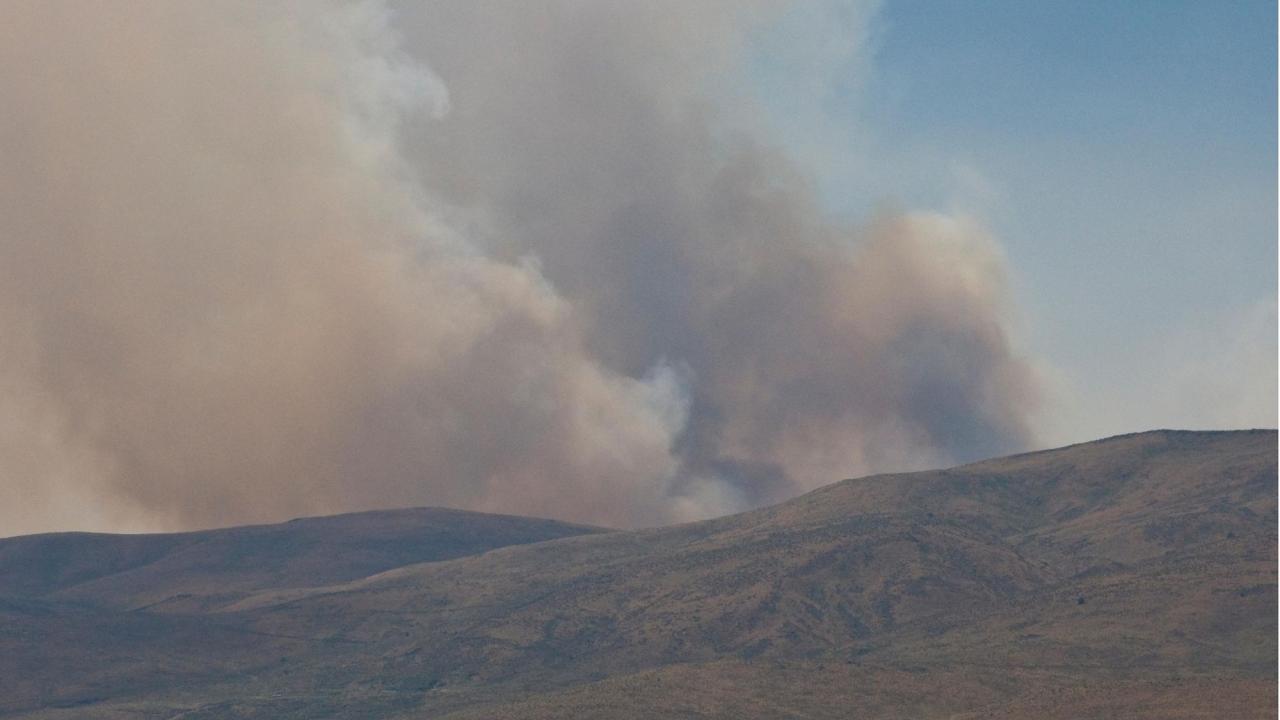
Early in the morning of 8 November 2018, the Camp wildfire started in the Sierra Foothills of Northern California, blazing through the town of Paradise to devastating effect. By 1 p.m. local time, the smoke plume from the fire stretched across the state, exposing millions of people to high concentrations of fine particulate matter. Smoke forecasting systems failed to capture this phenomenon, however, meaning an important opportunity to provide needed, timely information to health care personnel, air quality forecasters, and residents was lost. The reason for this failure was that the smoke forecasting systems could not capture the speed and intensity with which the fire grew based on the fire detection information at hand and because of shortcomings in conventional assumptions made about the timing and release of emissions by current wildfire smoke models.
Smoke from the Camp Fire hovers over the landscape, as photographed from a helicopter by the air resource adviser deployed on the fire. Credit: L. Tarnay, USDA Forest Service, Remote Sensing Lab
The ability to provide timely and accurate smoke forecasts for North America is growing only more important as wildfire occurrence and severity increase across much of the continent. The United States and Canada have recently experienced record wildfire years with far-reaching smoke impacts. And the expectation is that we will continue to see extensive wildfire seasons with large populations exposed to wildfire smoke, which contains many trace gases and aerosols that are harmful to human health [Jaffe et al., 2020].
Two satellites in the Geostationary Operational Environmental Satellite (GOES) program, GOES-16 and GOES-17, are the latest in a suite of satellite systems whose fire detection data are poised to help solve important problems in regional smoke modeling systems, especially with respect to large and explosive wildfire events that may require rapid responses to protect public health. These data, through their combined higher spatial and temporal resolution, offer unprecedented views of both smoke plume development and fire progression. The latest research using GOES-16 and -17 data indicates we will be better positioned to forecast harmful air quality from wildfire smoke in upcoming fire seasons.
Watching Fires from the Equator
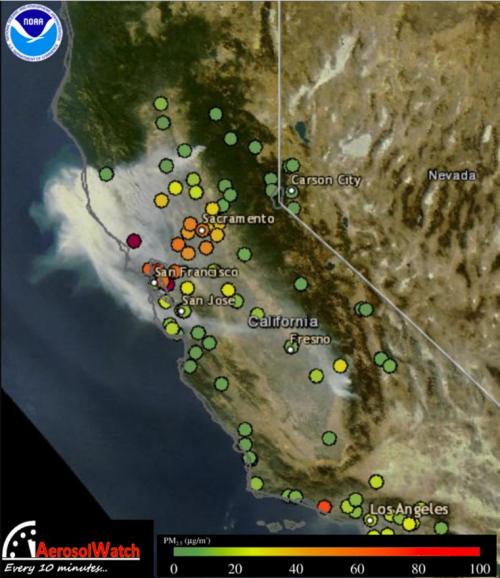
Visible satellite imagery from GOES-16 shows the Camp wildfire smoke plume at 2 p.m. local time on 8 November 2018. Circles are 1-hour average particulate matter concentrations from the U.S. Environmental Protection Agency (EPA) AirNow-Tech system. Credit: NOAA Aerosol Watch. Click image for larger version.
The GOES program, a joint NASA-NOAA project over the past 45 years, currently consists of two primary operational satellites that collect data with stationary perspectives, each one always imaging the same portion of the planet. GOES-16, which launched in November 2016 and became operational in December 2017, observes Earth from an equatorial vantage southeast of Florida; meanwhile, GOES-17, which launched in March 2018 and became operational February 2019, observes from near the equator southwest of Hawaii.
Instrumentation on earlier GOES satellites grouped visible to infrared wavelengths of light into five spectral bands, returning data every 15 minutes with 4-kilometer resolution at the center of its field of view. By contrast, GOES-16 and -17 instruments collect light in 16 spectral bands, returning data every 5 minutes with 2-kilometer resolution at the center of their view. The newer satellites thus dramatically improve our ability to view fire progression in real time and revolutionize our capability to model smoke production, making it possible to calculate fire emissions in near-real time as a fire moves.
Modeling the Camp Wildfire’s Smoke
Traditionally, models that quantify wildfire smoke emissions and model smoke plumes have applied a default daily profile to estimate and allocate hourly fractions of total daily emissions. That profile is based on trends typical of many wildfires: intense burning in the afternoon, with much less burning overnight and in the morning. The problem with this assumed model is that it may not accurately capture emissions when a fire does not follow the standard burning profile, especially when it burns large areas very quickly.
At the time of the Camp wildfire, regional smoke modeling systems considered fire detections from a preliminary data set from the NOAA Hazard Mapping System, which incorporated fire detections from the morning overpass of the Moderate Resolution Imaging Spectroradiometer (MODIS) instrument (aboard the Terra satellite) as well as some detections from GOES-16. From these data, the models made assumptions about the amount of burning and the resulting total daily fire emissions before allocating those emissions following the traditional diurnal profile (slower moving in the morning and picking up speed in the late afternoon).
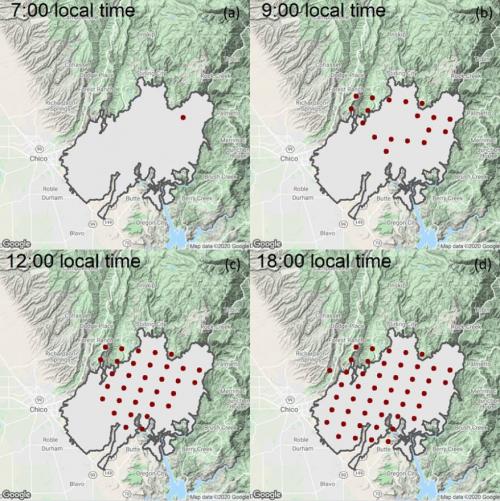
However, an examination of detailed temporal information available with the GOES-16 hot spot detections, such as 5-minute fire progressions, showed clearly that the Camp Fire spread quickly through the morning of 8 November, continued to be active through the afternoon, and then spread considerably again through the early evening (Figure 1). The first hot spot detection by GOES-16 was at approximately 7:10 a.m. PST, and by noon the fire had progressed through much of the roughly 220 square kilometers it would burn by 6 p.m. PST that evening. Thus, we can see that in some cases, such as in the Camp Fire, when local fuel and meteorological conditions combine with a fire ignition source to create rapid and widespread fire growth, assumptions made in the traditional profile applied in smoke modeling can break down.
The Path to Improvement
Improvements in wildfire smoke modeling are clearly still necessary, but we’re on a good path. In a 2019 study, Fangjun Li and colleagues fused fire radiative power (FRP) data—observations of instantaneous energy release by fires—from the MODIS instruments aboard the polar-orbiting Terra and Aqua satellites and from the previous generation of GOES satellites (GOES-11, -13, and -15) to provide greatly improved diurnal fire profile information by ecosystem [Li et al., 2019]. These researchers determined average diurnal profiles of fire emissions for 45 different ecosystems across the continental United States. Combining the polar-orbiting and geostationary FRP data takes advantage of the strengths of each data set: the higher spatial resolution of the MODIS data and the higher temporal resolution of the GOES data.
Relative to existing models, the team’s results suggested a shift in the peak timing of fire activity to earlier in the day—a finding that would have been helpful at the time of the Camp wildfire ignition. The novel approach also captures the important signatures of evening and nighttime fire activity that often accompany wildfires in California during Sundowner [Hatchett et al., 2018], Diablo [Mass and Ovens, 2019], and Santa Ana [Westerling et al., 2004] wind conditions. This work is an important step forward for default diurnal profiles for smoke forecasting systems. However, the approach still breaks down for cases such as the Camp wildfire, with its initial early morning ignition and growth, leaving room for additional improvement.
There are existing fire behavior models (e.g., those from Mell et al. [2007], Linn et al. [2002], Coen et al. [2013], and Mandel et al. [2014]) designed to simulate combustion and the advancement of fire fronts. But in general, these models are complex and computationally expensive and thus not well set up for use in operational environments at regional scales, in which rapid analysis of data is needed to aid in decisionmaking. GOES-16 data, which are ready for use in near-real time, provide a computationally efficient alternative to begin including fire behavior modeling in operational environments.
For regional smoke modeling systems, the GOES-16 5-minute Fire Detection and Characterization (FDC) product provides a unique opportunity to customize time profiles for large wildfires. When hot spots are detected under good viewing conditions, the FDC provides an estimate of FRP, which is related to how intensely a fire is burning and how much smoke it is emitting. However, for some hot spots identified as burning, not enough information is available to estimate FRP, for example, because the satellite view is obscured by extremely thick smoke. In such cases, FRP can be estimated by interpolating between times when viewing conditions are better and when reliable estimates of FRP are available (although another fire behavior modeling approach is needed when the satellite view is obscured for a day or longer). The result is a complete FRP record for each hot spot at 5-minute resolution, which can then be integrated to produce hourly total fire radiation energy (FRE) profiles. Finally, the hourly FRE is summed across all the hot spots in a fire to produce a custom time profile.
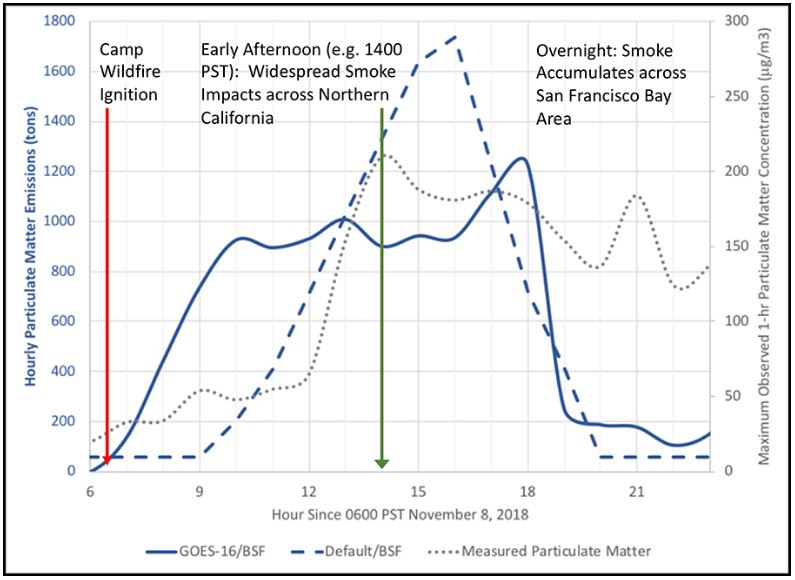
We have applied this approach in the case of the Camp Fire, for which the traditional diurnal profile missed the significant activity that occurred before noon, meaning peak emissions were projected to occur several hours later than they actually did (Figure 2). The assumed default peak of fire activity also ended too early. These differences in emission timing between reality and what was modeled propagated to subsequent smoke transport modeling.
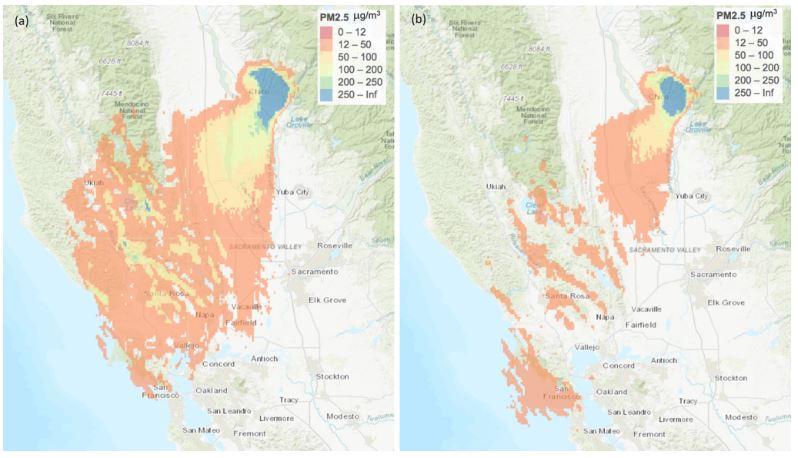
Using the GOES-16 fire detection locations and a custom time profile, we can calculate particulate matter emissions on the basis of information about the vegetation on the landscape and how that vegetation combusts [Larkin et al., 2009]. That allowed us to model near-surface 1-hour average particulate matter concentrations for the Camp wildfire using an atmospheric dispersion model developed by Stein et al. [2015]. Hour-by-hour modeling with this approach revealed that widespread smoke and pockets of heavy smoke were visible, for example, in the early afternoon north of San Francisco, where observational data at Sebastopol measured 210 micrograms per cubic meter (Figure 3a). Using the traditional diurnal profile and fire detections, much of the fire activity until that time was not modeled, resulting in the models indicating much less smoke traveling across the state than what actually occurred in the early afternoon (Figure 3b).
Limitations and Opportunities
Analyses relying on satellite fire detections to model emissions face limitations, for example, because of clouds or very heavy smoke obscuring a satellite’s view of a fire. In addition, the size and speed of fires that can be analyzed may be limited. The approach using GOES-16 satellite fire detection data to define a custom diurnal fire emissions profile for smoke modeling is best applied to larger wildfires (in this case, wildfires greater than approximately 8,000 hectares) because of the spatial resolution of the detections. Modeling smaller fires requires higher spatial resolution data, such as those from the polar-orbiting satellites, which provide snapshot data two to four times per day.
The approach described here can be used to provide customized smoke modeling products for large wildfire events.
However, the approach lends itself well to using NASA’s Fire Energetics and Emissions Research (FEER) algorithm [Ichoku and Ellison, 2014] to estimate total particulate emissions directly from the GOES-16 FRE. Using FRE with the FEER method provides an alternative to ground-based emissions calculations—a benefit because the FEER method can be applied globally, is very easy to use, can be calculated as soon as the satellite detection is processed, and offers a consistent methodology and result over large scales.
In general, the approach described here can be used to provide customized smoke modeling products for large wildfire events. Such products will help inform smoke forecasts from air resource advisers that are congressionally mandated through the Interagency Wildland Fire Air Quality Response Program, as well as information that goes out to health and air quality agencies and, ultimately, to the public.
Many satellite instruments contribute to advance our understanding of and responses to wildfires. The addition of GOES-16 and -17 data to the global suite of satellite products offers valuable views of both smoke plume development and fire progression and provides opportunities to better simulate the impacts of smoke on human health.
Acknowledgments
Our work is supported by the U.S. Department of Agriculture Forest Service and the NASA Health and Air Quality Applied Sciences Team (project NNH16AD18I). Special thanks go to Patti Loesche for technical editing and review and Mazama Science for the PWFSLSmoke R statistical package. The views expressed in this publication are those of the authors and do not represent the policies or opinions of any U.S. government agency.
References
Coen, J. L., et al. (2013), WRF-Fire: Coupled weather-wildland fire modeling with the Weather Research and Forecasting Model, J. Appl. Meteorol. Clim., 52(1), 16–38, https://doi.org/10.1175/JAMC-D-12-023.1.
Hatchett, B. J., et al. (2018), Brief communication: Synoptic-scale differences between Sundowner and Santa Ana wind regimes in the Santa Ynez Mountains, California, Nat. Hazards Earth Syst. Sci., 18(2), 419–427, https://doi.org/10.5194/nhess-18-419-2018.
Ichoku, C., and L. Ellison (2014), Global top-down smoke-aerosol emissions estimation using satellite fire radiative power measurements, Atmos. Chem. Phys., 14, 6,643–6,667, https://doi.org/10.5194/acp-14-6643-2014.
Jaffe, D. A., et al. (2020), Wildfire and prescribed burning impacts on air quality in the United States, J. Air Waste Manage. Assoc., 70, 583–615, https://doi.org/10.1080/10962247.2020.1749731.
Larkin, N. K., et al. (2009), The BlueSky smoke modeling framework, Int. J. Wildland Fire, 18(8), 906–920, https://doi.org/10.1071/WF07086.
Li, F., et al. (2019), Estimation of biomass-burning emissions by fusing the fire radiative power retrievals from polar-orbiting and geostationary satellites across the conterminous United States, Atmos. Environ., 211, 274–287, https://doi.org/10.1016/j.atmosenv.2019.05.017.
Linn, R., et al. (2002), Studying wildfire behavior using FIRETEC, Int. J. Wildland Fire, 11(4), 233–246, https://doi.org/10.1071/WF02007.
Mandel, J. S., et al. (2014), Recent advances and applications of WRF-SFIRE, Nat. Hazards Earth Syst., 14(10), 2,829–2,845, https://doi.org/10.5194/nhess-14-2829-2014.
Mass, C. F., and D. Ovens (2019), The Northern California wildfires of 8-9 October 2017: The role of a major downslope wind event, Bull. Am. Meteorol. Soc., 100(2), 235–256, https://doi.org/10.1175/BAMS-D-18-0037.1.
Mell, W., et al. (2007), A physics-based approach to modelling grassland fires, Int. J. Wildland Fire, 16(1), 1–22, https://doi.org/10.1071/WF06002.
Stein, A. F., et al. (2015), NOAA’s HYSPLIT atmospheric transport and dispersion modeling system, Bull. Am. Meteorol. Soc., 96(12), 2,059–2,077, https://doi.org/10.1175/BAMS-D-14-00110.1.
Westerling, A. L., et al. (2004), Climate, Santa Ana Winds and autumn wildfires in Southern California, Eos Trans. AGU, 85(31), 289–296, https://doi.org/10.1029/2004EO310001.
Author Information
Susan O’Neill ([email protected]), Pacific Northwest Research Station, Forest Service, U.S. Department of Agriculture, Seattle, Wash.; and Sean Raffuse, Air Quality Research Center, University of California, Davis
Original post for citation: https://eos.org/science-updates/advances-in-satellite-data-for-wildfire-smoke-forecasting
Citation: O’Neill, S., and S. Raffuse (2021), Advances in satellite data for wildfire smoke forecasting, Eos, 102, https://doi.org/10.1029/2021EO155076. Published on 26 February 2021.