Map of U.S. Auto Emissions
More than 60% of transportation emissions come from passenger vehicles in the U.S. This makes personal transportation the largest source of greenhouse gases. "Boston University’s emissions database, first published in 2015 and updated this month with an additional five years of data, reveals that much of the increase in driving-related CO2 has occurred in and around cities."
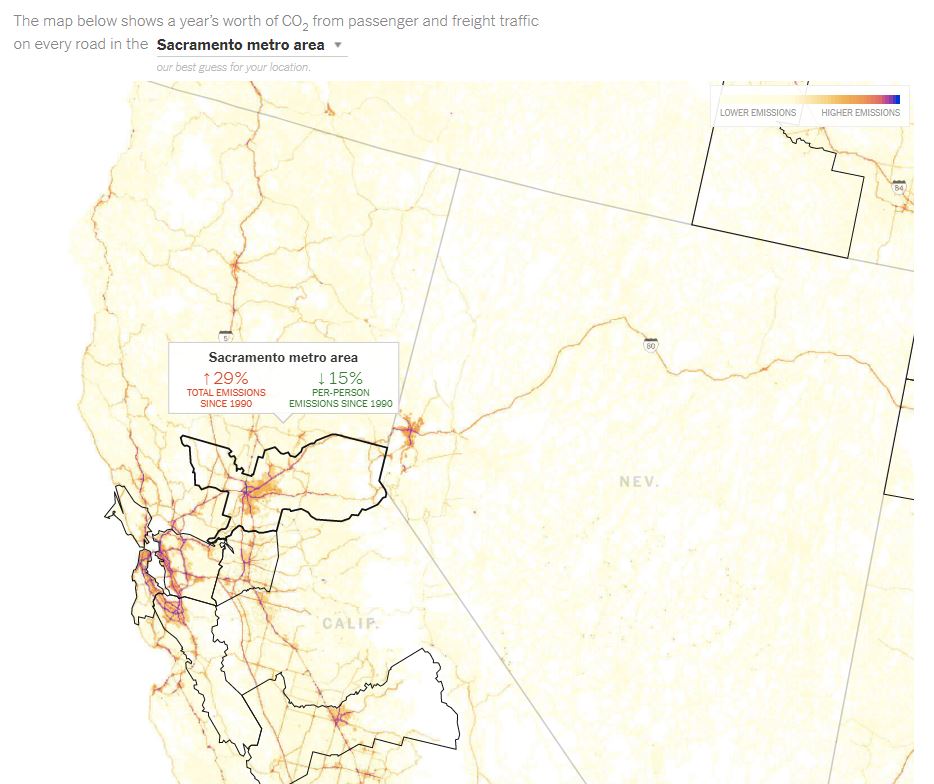
Take a look at your cities emissions and how they have changed over the years.
Credit: New York Times Article By Nadja Popovich and Denise Lu on Oct. 10, 2019